Dashboard

Your dashboard gives you a complete overview of your employee advocacy program.
The dashboard includes:
Analytics overview
The dashboard is a collection of all stats on the platform - from distributed content to SociuuHub activity.
Choose the period you wish to see in the top right corner.
Distributed
Employee inclusion: The total amount of invited users during the selected period. Go to users and download the user list to see who has not been activated.
Groups Activation: Indicate how many groups are activated out of the total amount of user groups.
Email Open Rate: This shows the total number of emails opened and the open rate for emails sent to employees. Please note that customers with employee advocacy programs from before 2019 can have emails without an open rate. Select a period after 2019 to see accurate open rates.
Employee Engagement: This shows you how many employees have shared - this is also your employee engagement rate. The percentage is calculated on behalf of employee inclusion / unique sent emails. You can see individual users' performance in the user list or in engagement stats

SENT EMAILS
Total sent represents the overall number of emails you've sent to employees with content to share.
To individual user counts how many user have received the above total sent emails.
EMAIL CAMPAIGNS
This shows you how many campaigns you have created and how many of these are regular, direct, and video -posts. Email campaigns are the individual content pieces in the emails. You can see all your posts and individual post stats in the post list.
SHARES
Content Shared is the total amount of content that has been shared by the employees. A share is defined by one user, sharing one content piece to one network. To the left, you see the total number of content pieces shared by the employees. The bracket indicates the number of shares that can be confirmed either through a click on the post-link or via Social Connection activated.
For example:
When a user shares a post on LinkedIn, it counts as 1 share.
If the same user shares the post on Facebook as well, the total share count
increases to 2 shares. However, if the user attempts to share the post again on
either LinkedIn or Facebook, the share count will remain at 2—unless we can
confirm, through clicks or social connections, that the additional share is actually live.
Before the 21th February 2025 all share attempts were counted.
User Shared is the amount of users that have shared a content/post.
BUSINESS OUTCOME
Clicks are the total amount of clicks on published social media posts.
This is the networks' reactions and you can see the correlation between
employee shares and network reactions in post effectiveness.
View count is the total amount of views on video posts.
Clicks/Share indicate the average number of clicks an employee receives per
shared post. This is calculated by dividing the total number of clicks by the total
number of (confirmed) shares.
For example, as shown in the images, 25,231 clicks ÷ 2,783 shares = 9.06 clicks per share.
Content Engagement indicates the amount of clicks, reactions, and comments received.
The bracket shows confirmed engagement through click on post-link, or via Social Connection activated.
For example, by subtracting 25,231 clicks from the total 25,783 content engagements, we get 552 representing the number of comments or other reactions.


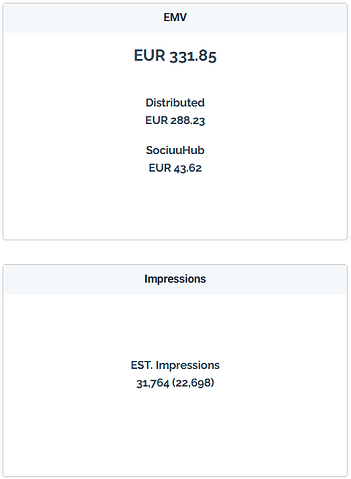
EMV
Earned Media value is calculated based on your clicks and views. Here you can see what the cost-per-click would be through paid-media. You can use Sociuu's default, which is updated once a year, or you can customize your own EMV values, should you already know these numbers.
EST. Impressions
EST. Impressions (Estimated Impressions) give you an indication of how many times your content could have been displayed across your connected social networks. They provide a simple way to understand your potential reach, even when exact impression data is not available.
SociuuHub
Content Shared is the total amount of content that has been shared by the employees. A share is defined by one user, sharing one content piece to one network. To the left, you see the total number of content pieces shared by the employees. The bracket indicates the number of shares that can be confirmed either through a click on the post-link or via Social Connection activated.
For example:
When a user shares a post on LinkedIn, it counts as 1 share. If the same user shares the post on Facebook as well, the total share count increases to 2 shares. However, if the user attempts to share the post again on either LinkedIn or Facebook, the share count will remain at 2—unless we can confirm, through clicks or social connections, that the additional share is actually live.
User Shared is the amount of users that have shared a content/post.
Clicks are the total amount of clicks on published social media posts. This is the networks' reactions to employees' posts
Clicks per share indicate the average number of clicks an employee receives per shared post. This is calculated by dividing the total number of clicks by the total number of (confirmed) shares.
For example, as shown in the image below, 1,320 clicks ÷ 105 shares = 12.57 clicks per share.
Earned Media value is calculated based on your clicks and views. Here you can see what the cost-per-click would be through paid-media. You can use Sociuu's default, which is updated once a year, or you can customize your own EMV values, should you already know these numbers.
Content Engagement indicates the amount of clicks, reactions, and comments received.
The bracket shows confirmed engagement through click on post-link, or via Social Connection activated.
For example, by subtracting 1,320 clicks from the total 1,341 content engagements, we get 21 representing the number of comments or other reactions.

Performance Metrics

Top Performing Groups
This list shows you the most active usergroups divided by engagement.
You can manage and create new usergroups in Sociuu or by uploading.
In the menu, you can also see more group stats.
Adoption Rate
Adoption rate is how many employees you activate over time. You will see a development for push campaigns, pull campaigns from Sociuu Hub and total.
If you see a fall in the rate, it is due to a load of new users. As the number of employee base increases the adoption will decrease and increase again as you invite more users to share.
Go to user list or download the user list to see inactive users. It can both be users that never shared before or users that have never been sent an email.


Total Engagement Development
Engagement development shows you the engagement the past year.
Put the cursor on a specific period to see the engagement at that time.
Frequency Ratio
The blue dots indicate how many posts you have created per month.
Frequency is important because the amount of shared posts is a necessity to gain insights about performance and engagement.

TOTAL ENGAGEMENT DEVELOPMENT AND FREQUENCY RATIO
These two metrics complement each other well!
By analyzing total engagement development over a selected period, you can assess whether performance is improving or declining. Comparing this with the Frequency Ratio chart helps determine if the number of posts sent during that period is sufficient to explain these trends.
For example: In February, I sent out a total of 8 posts to my employees. During the same period, those posts were shared a total of 54 times. By analyzing these numbers, I can assess the effectiveness of my communication. If engagement is high, it may indicate that my content resonates well with employees. However, if engagement is lower than expected, I might consider adjusting my messaging or increasing the frequency of posts to encourage more interaction.

